Bar chart in excel represent the categorical data in bars or columns. It can be plotted horizontally and vertically. It can be used to compare values visually when there is few category.
Steps to Create Bar chart in Excel:
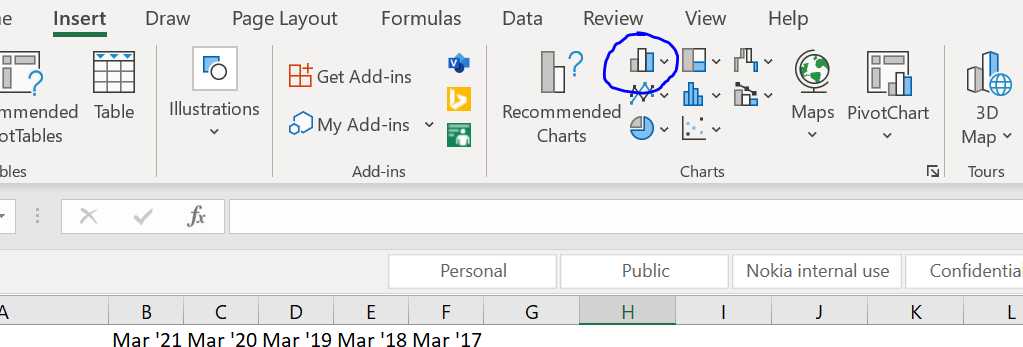
First got to Insert tab in excel then insert bar chart from option as shown below

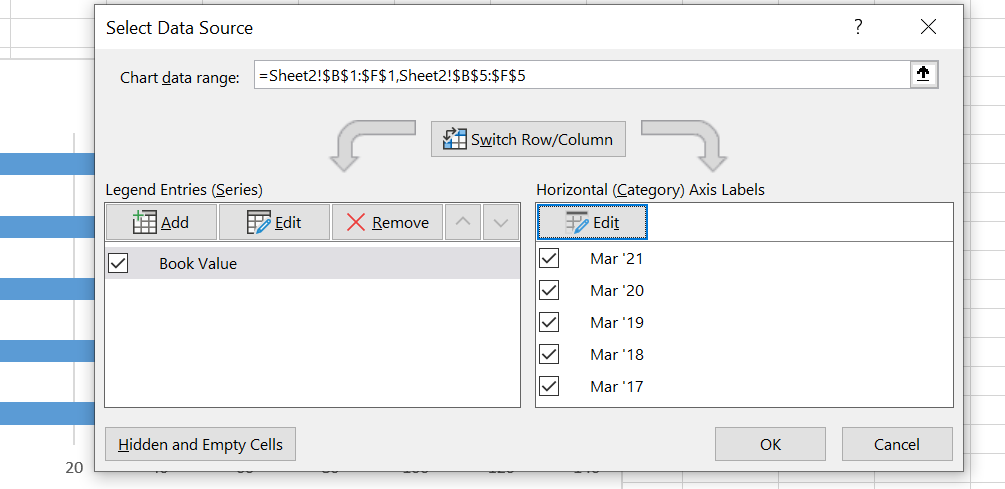
a blank or chart with data will be inserted then right click on that chart and click on select data as shown below

Then click on add data and write chart name in series name column.It will be display on top then select range of values that we want to plot.If we want to plot for book value we have to write book value in series name and corresponding row for data and the axis label range.

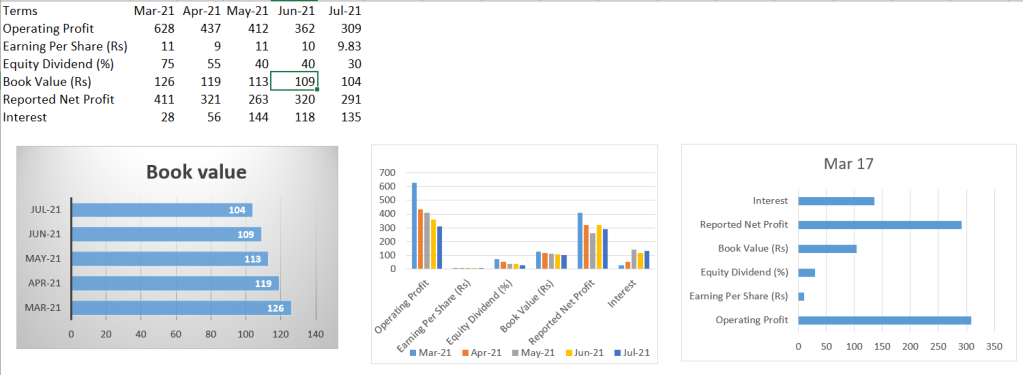
then a chart will be plotted similarly we can plot bar and format accordingly as per requirement as shown below.
